Usage Examples for MDDC in Python#
Authors: Raktim Mukhopadhyay, Anran Liu, Marianthi Markatou
[1]:
import warnings
from datetime import datetime

import numpy as np
import pandas as pd
from IPython.display import Markdown, display

warnings.filterwarnings("ignore")


current_date = datetime.now().strftime("%d %B, %Y")
display(Markdown(f"**Date Updated:** {current_date}"))
Date Updated: 07 April, 2025
[2]:
import MDDC

MDDC.__version__
[2]:
'1.1.0'
Introduction#
This vignette contains various examples that illustrate usage of MDDC.
Installation#
The MDDC package is available on PyPI and can be installed using pip. Additionally, the development version can be found on GitHub.
Dataset#
We have included an adverse event dataset curated from FDA Adverse Event Reporting System (FAERS) called statin49 dataset which we will be using for describing the functionalities of MDDC. statin49 was downloaded and processed from the FAERS database, covering the period from the third quarter of 2014 (Q3 2014) to the fourth quarter of 2020 (Q4 2020). This dataset is a \(50 \times 7\) contingency table. The first 49 rows represent 49 important AEs associated with the statin
class, while the final row aggregates the remaining 5,990 AEs.
[3]:
statin49 = MDDC.datasets.load_statin49_data()
[4]:
statin49.head()
[4]:
| Atorvastatin | Fluvastatin | Lovastatin | Pravastatin | Rosuvastatin | Simvastatin | Other | |
|---|---|---|---|---|---|---|---|
| Rhabdomyolysis | 2041 | 52 | 44 | 163 | 936 | 1376 | 31707 |
| Muscle Disorder | 291 | 2 | 7 | 21 | 191 | 87 | 7329 |
| Muscle Fatigue | 85 | 0 | 2 | 16 | 30 | 39 | 4257 |
| Muscle Haemorrhage | 24 | 0 | 0 | 5 | 13 | 4 | 3806 |
| Muscle Necrosis | 68 | 2 | 0 | 1 | 10 | 20 | 662 |
[5]:
statin49_cluster_idx = MDDC.datasets.load_statin49_cluster_idx_data()
[6]:
statin49_cluster_idx.head()
[6]:
| cluster_idx | Atorvastatin | Fluvastatin | Lovastatin | Pravastatin | Rosuvastatin | Simvastatin | Other | |
|---|---|---|---|---|---|---|---|---|
| Rhabdomyolysis | 1 | 2041 | 52 | 44 | 163 | 936 | 1376 | 31707 |
| Muscle Disorder | 1 | 291 | 2 | 7 | 21 | 191 | 87 | 7329 |
| Muscle Fatigue | 1 | 85 | 0 | 2 | 16 | 30 | 39 | 4257 |
| Muscle Haemorrhage | 1 | 24 | 0 | 0 | 5 | 13 | 4 | 3806 |
| Muscle Necrosis | 1 | 68 | 2 | 0 | 1 | 10 | 20 | 662 |
Adverse Event (AE) identification with MDDC#
Using Boxplot Method#
[7]:
boxplot_results = MDDC.MDDC.mddc(
    contin_table=statin49,
    method="boxplot",
    col_specific_cutoff=True,
    separate=True,
    if_col_corr=False,
    corr_lim=0.8,
)
[8]:
print(
    f"The boxplot method result contains the following components:{boxplot_results._fields}"
)
The boxplot method result contains the following components:('signal', 'corr_signal_pval', 'corr_signal_adj_pval')
MDDC with boplot method function outputs a list with three components as seen above:
signal: An \(I \times J\) data matrix with entries 1 or 0, indicating the signals identified in step 2. A value of 1 indicates signals, 0 indicates no signal.corr_signal_pval: An \(I \times J\) data matrix of p-values for each cell in the contingency table from step 5, when the \(r_{ij}\) values are mapped back to the standard normal distribution.corr_signal_adj_pval: An \(I \times J\) data matrix of the Benjamini-Hochberg adjusted p-values for each cell in step 5. Users can choose whether to usecorr_signal_pvalorcorr_signal_adj_pval, and can set their own p-value threshold (for example, 0.05).
Below, we display the first few rows and columns for each component of boxplot_result.
[9]:
boxplot_results.signal.head(6)
[9]:
| Atorvastatin | Fluvastatin | Lovastatin | Pravastatin | Rosuvastatin | Simvastatin | Other | |
|---|---|---|---|---|---|---|---|
| Rhabdomyolysis | 1 | 0 | 0 | 1 | 1 | 1 | 0 |
| Muscle Disorder | 0 | 0 | 0 | 0 | 1 | 0 | 0 |
| Muscle Fatigue | 0 | 0 | 0 | 0 | 0 | 0 | 0 |
| Muscle Haemorrhage | 0 | 0 | 0 | 0 | 0 | 0 | 0 |
| Muscle Necrosis | 0 | 0 | 0 | 0 | 0 | 0 | 0 |
| Muscle Rupture | 0 | 0 | 0 | 1 | 0 | 0 | 0 |
[10]:
boxplot_results.corr_signal_pval.round(3).head(6)
[10]:
| Atorvastatin | Fluvastatin | Lovastatin | Pravastatin | Rosuvastatin | Simvastatin | Other | |
|---|---|---|---|---|---|---|---|
| Rhabdomyolysis | NaN | NaN | NaN | NaN | NaN | NaN | NaN |
| Muscle Disorder | 0.527 | 0.974 | 0.178 | 0.545 | 0.000 | 0.618 | 0.783 |
| Muscle Fatigue | 0.556 | 0.834 | 0.252 | 0.061 | 0.656 | 0.554 | 0.428 |
| Muscle Haemorrhage | 0.561 | 0.635 | 0.521 | 0.307 | 0.570 | 0.673 | 0.387 |
| Muscle Necrosis | 0.534 | 0.186 | 0.869 | 0.835 | 0.677 | 0.509 | 0.301 |
| Muscle Rupture | 0.569 | 0.019 | 0.999 | 0.000 | 0.678 | 0.489 | 0.915 |
In this output, we observe that the first row, corresponding to the adverse event Rhabdomyolysis, does not have associated p-values. This is because, in step 2 of the algorithm, Rhabdomyolysis was already identified as an AE signal for Atorvastatin, Pravastatin, Rosuvastatin, and Simvastatin. Consequently, the standardized Pearson residual values for these four drugs were replaced with NA. With only two residual values remaining in the first row, it was not possible to find connected AEs for Rhabdomyolysis. Therefore, this adverse event was excluded from the subsequent steps of the analysis.
Note that for computing Pearson correlation in step 3, at least three values are required in the matching positions. Applying a p-value threshold of 0.05, we identify the following pairs as signals by considering AE correlations:
(Muscle Rupture, Fluvastatin)
(Muscle Rupture, Pravastatin)
(Muscle Disorder, Rosuvastatin)
Function for Finding Optimal Boxplot Coefficient#
[11]:
MDDC.MDDC.find_optimal_coef(
    contin_table=statin49,
    rep=1000,
    target_fdr=0.05,
    grid=0.1,
    col_specific_cutoff=True,
    exclude_small_count=True,
)
[11]:
OptimalCoef(coef=array([2.6, 3.4, 3. , 2.6, 2.7, 2.5, 1.9]), FDR=array([0.042, 0.05 , 0.047, 0.05 , 0.047, 0.048, 0.037]))
This function outputs a list with the following components:
coef: A numeric vector containing the optimal coefficient ‘coef’ for each column of the input contingency table.FDR: A numeric vector with the corresponding false discovery rate (FDR) for each column.
Using Monte Carlo Method#
[12]:
mc_results = MDDC.MDDC.mddc(
    contin_table=statin49,
    method="monte_carlo",
    rep=10000,
    exclude_same_drug_class=True,
    col_specific_cutoff=True,
    separate=True,
    if_col_corr=False,
    corr_lim=0.8,
)
[13]:
print(
    f"The Monte Carlo method result contains the following components:{mc_results._fields}"
)
The Monte Carlo method result contains the following components:('pval', 'pval_fisher', 'signal', 'fisher_signal', 'corr_signal_pval', 'corr_signal_adj_pval')
pval: p-values for each cell in the step 2 of the algorithm, calculated using the Monte Carlo method.pval_fisher: p-values for each cell in the step 2 of the algorithm, calculated using the Monte Carlo method for cells with count greater than five and p-values obtained from the Fisher’s exact test for cells with count less than or equal to five in the contingency table.signal:: Indicates signals for cells with counts greater than five, identified in step 2 by the MC method. A value of 1 indicates a signal, while 0 indicates no signal.fisher_signal: Indicates signals for cells with counts less than or equal to five, identified in step 2 by Fisher’s exact tests. A value of 1 indicates a signal, while 0 indicates no signal.corr_signal_pval: Returns the p-values for each cell in the contingency table in step 5, where the \(r_{ij}\) values are mapped back to the standard normal distribution.corr_signal_adj_pval: Returns the Benjamini-Hochberg adjusted p-values for each cell in step 5. Users can choose whether to usecorr_signal_pvalorcorr_signal_adj_pval, and select an appropriate p-value threshold (for example, 0.05).
Function for Reporting#
For ease of use and understanding the identified signals, we have also included a utility function which extracts the signals from the signal matrix and constructs a dataframe.
The function report_drug_AE_pairs() displays the identified (AE, drug) pairs as well as the observed count, expected count, and the standardized Pearson residuals for the pairs. This function takes two arguments:
contin_table: A data matrix representing an \(I \times J\) contingency table, with rows corresponding to adverse events and columns corresponding to drugs.contin_table_signal: A data matrix with the same dimensions and row and column names ascontin_table. Entries should be either 1 (indicating a signal) or 0 (indicating no signal). This matrix can be obtained by applying theMDDC.MDDC.mddc()functions tocontin_table.
[14]:
report_df = MDDC.utils.report_drug_AE_pairs(statin49, mc_results.signal)

report_df.head()
[14]:
| Drug | AE | Observed Count | Expected Count | Std Pearson Resid | |
|---|---|---|---|---|---|
| 0 | Atorvastatin | Rhabdomyolysis | 2041 | 112.0567 | 182.5555 |
| 1 | Atorvastatin | Muscle Disorder | 291 | 24.4606 | 53.9791 |
| 2 | Atorvastatin | Muscle Fatigue | 85 | 13.6650 | 19.3279 |
| 3 | Atorvastatin | Muscle Haemorrhage | 24 | 11.8848 | 3.5198 |
| 4 | Atorvastatin | Muscle Necrosis | 68 | 2.3541 | 42.8516 |
Simulating datasets with grouped AEs#
contin_table: A data matrix representing an \(I \times J\) contingency table with rows corresponding to adverse events and columns corresponding to drugs. The row and column marginals are used to generate the simulated data.signal_mat: A data matrix of the same dimensions as the contingency table with entries indicating the signal strength. Values must be greater than or equal to 1, where 1 indicates no signal, and values greater than 1 indicate a signal.cluster_idx: A numpy.ndarray, list or pandas.DataFrame denoting the cluster index of the various AEs.n: The number of simulated contingency tables to be generated.rho: A numeric value representing the correlation of the AEs within each cluster. The default is 0.5.n_job:: n_jobs specifies the maximum number of concurrently running workers.seed: Random seed for reproducibility of the simulation.
[15]:
contin_table = statin49_cluster_idx.drop(columns=["cluster_idx"])
cluster_idx = statin49_cluster_idx["cluster_idx"].to_list()
signal_mat = pd.DataFrame(np.ones(contin_table.shape))
signal_mat.columns = list(contin_table.columns)
signal_mat.index = list(contin_table.index)

# A signal of strength 4 is embedded in Rhabdomyolysis for Atorvastatin
signal_mat.at["Rhabdomyolysis", "Atorvastatin"] = 4
[16]:
simulated_datasets = MDDC.utils.generate_contin_table_with_clustered_AE(
    row_marginal=None,
    column_marginal=None,
    contin_table=contin_table,
    signal_mat=signal_mat,
    cluster_idx=cluster_idx,
    n=3,
    rho=0.5,
    seed=42,
)
[17]:
mc_results_with_sim_data = MDDC.MDDC.mddc(simulated_datasets[0], method="monte_carlo")
[18]:
mc_report_with_sim_datasets_df = MDDC.utils.report_drug_AE_pairs(
    simulated_datasets[0], mc_results_with_sim_data.signal
)

mc_report_with_sim_datasets_df
[18]:
| Drug | AE | Observed Count | Expected Count | Std Pearson Resid | |
|---|---|---|---|---|---|
| 0 | Atorvastatin | Rhabdomyolysis | 418.0 | 113.1999 | 28.7004 |
In the above output, we can see that the identified signal pair is (Atorvastatin, Rhabdomyolysis) which matches the signal embedded previously.
Visualization#
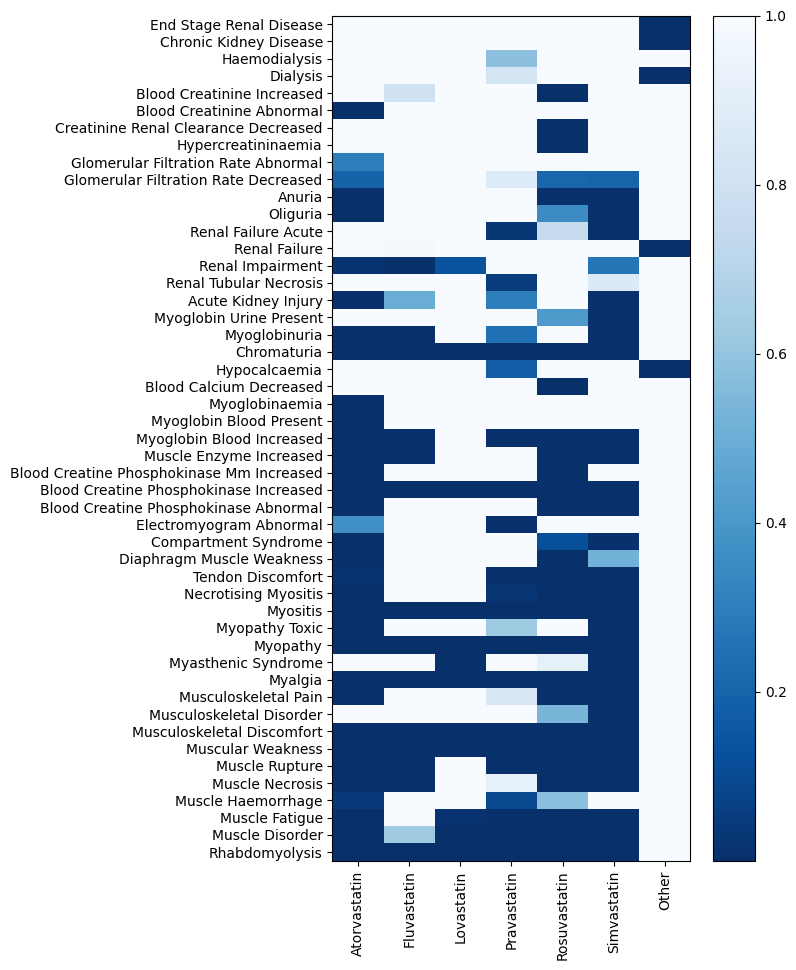
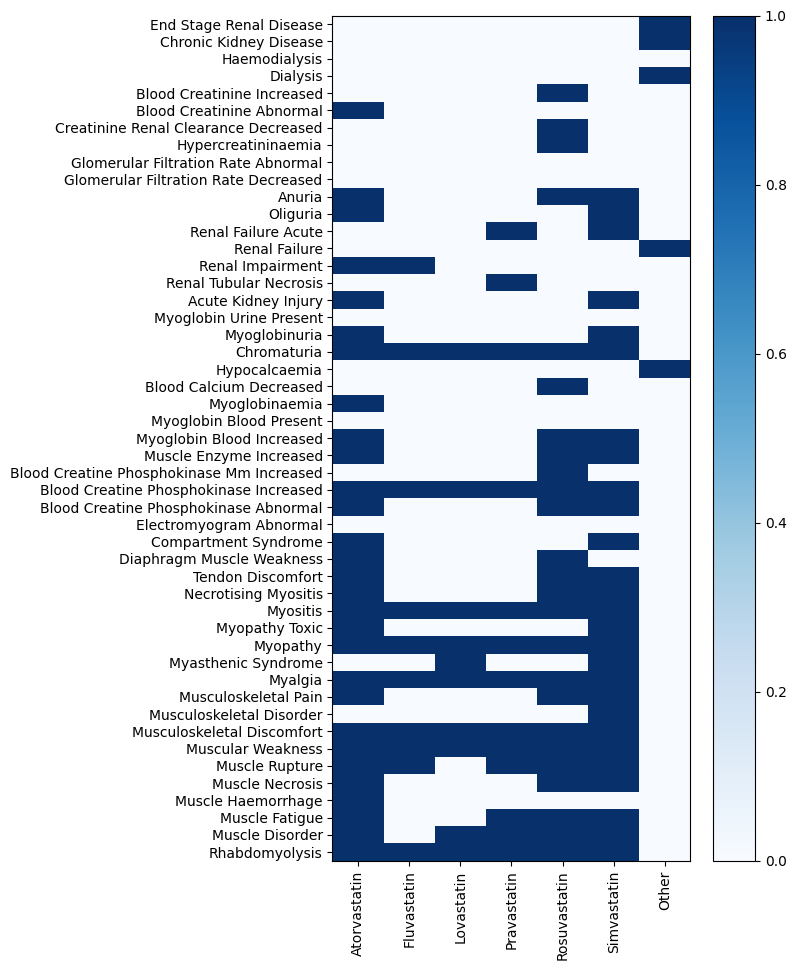
We have also included heatmap visulizations as a part of our package to help visualize the identified signals or p-values.
This function takes the following arguments:
data:The data to be plotted as a heatmap. This attribute should be a numpy.ndarray or pandas.DataFrame.size_cell:The size of each cell in the heatmap, which affects the dimensions of the resulting plot.
[19]:
# visualizing the identified signals
MDDC.utils.plot_heatmap(mc_results.signal.iloc[:-1], cmap="Blues")
[19]:
[20]:
# visualizing the p-values
MDDC.utils.plot_heatmap(mc_results.pval.iloc[:-1], cmap="Blues_r")
[20]: